
About the author
Last article in our series on the use of visual management according to our FLOW Project Management methodology. If you first want to (re) read the previous articles, click the following links: We describe typical behaviors that we have had the opportunity to observe in project environments during the discovery day. While it's fun to … Continued
Last article in our series on the use of visual management according to our FLOW Project Management methodology.
If you first want to (re) read the previous articles, click the following links:
While it's fun to describe these behaviors, the fact remains that they can be value judgments!
Let's see if the fever chart can help us detect some of these behaviors. Consider the following two graphs:
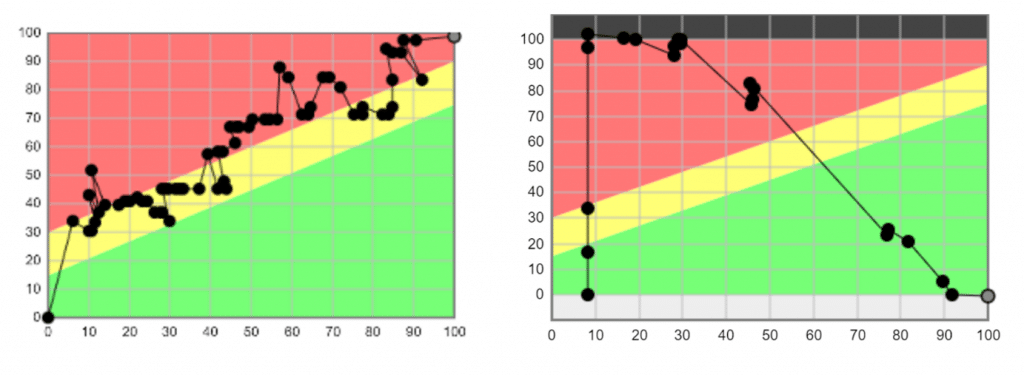
What is true. But our informed eye may be starting to spot a suspicious phenomenon.
Indeed, the project never seems to drift:
Surprising, no?
This practice refers to Parkinson's Law. It is the fact of always keeping the initially estimated duration.
So in the left graph, you have the illustration of a team which adapts its speed according to the buffer's consumption.
First of all, we can be happy with what happened. Indeed, the project ended without consuming any buffer.
It indicates that the project has gone faster than expected and that there may still be room in the tasks.
However, there is another suspicious phenomenon in this graph. Indeed, initially, the project stagnated enormously. Then, the project moves forward to come out of the dark. Then it stagnates again, advances rapidly, etc.
In fact, this phenomenon is an illustration of the Student Syndrome, or how to wait until the last moment to get started.
In this specific case, we can see these stop & go up to 45/50% progress. Then, the project team definitely speeds up to complete their project much faster.
And you, what types of behaviors do you face in project management?
Thank you for following this series of articles, we hope they will help you understand our project management methodology and give you the interest to meet our team!
For any questions or discussion on project management, do not hesitate to contact me: anthony.fouque@agilea-group.com and do not forget to follow AGILEA on LinkedIn in order to see the latest articles, news, training, missions ... etc.
About the author
Go further
 Flow Project Management
At this point, everything is going well: But, there are several projects that use the same resources. So, how do you manage this? Most people will tell you that having a project management tool that collects load and capacity will help you drive your choices. This is simply not true. Most load / capacity tools … Continued
 Flow Project Management
Once you have completed your project plan, sized the tasks and avoided creating a labyrinthine system with too much detail, you need to move on to the step that will identify the most time critical task sequence. At this point, we recommend that you use the critical chain approach. Unlike the critical path approach, which … Continued
 Flow Project Management
You made your project plan (episode 1). Then you verified that it was at the right level of detail (episode 2)... knowing that there is an uncertainty that you will discover. How will/should you incorporate these elements into the project plan update? Whoa, slow down! We are going to integrate EVERYTHING into the schedule, aren't … Continued
Does this article resonate?
Our consultants help you translate these reflections to your Supply Chain and your teams — diagnosis, scoping or operational delivery.