
About the author
In this series of articles intended for visual management according to our FLOW Project Management approach, we will see how the use of fever charts can help you detect and implement continuous improvement actions. If you want to (re) read the previous articles, click the following links ⤵️ So how can the fever chart help … Continued
In this series of articles intended for visual management according to our FLOW Project Management approach, we will see how the use of fever charts can help you detect and implement continuous improvement actions.
If you want to (re) read the previous articles, click the following links ⤵️
Let's take the following 6 Fever Charts and focus on the top 3, and the bottom left one. Do you see something?
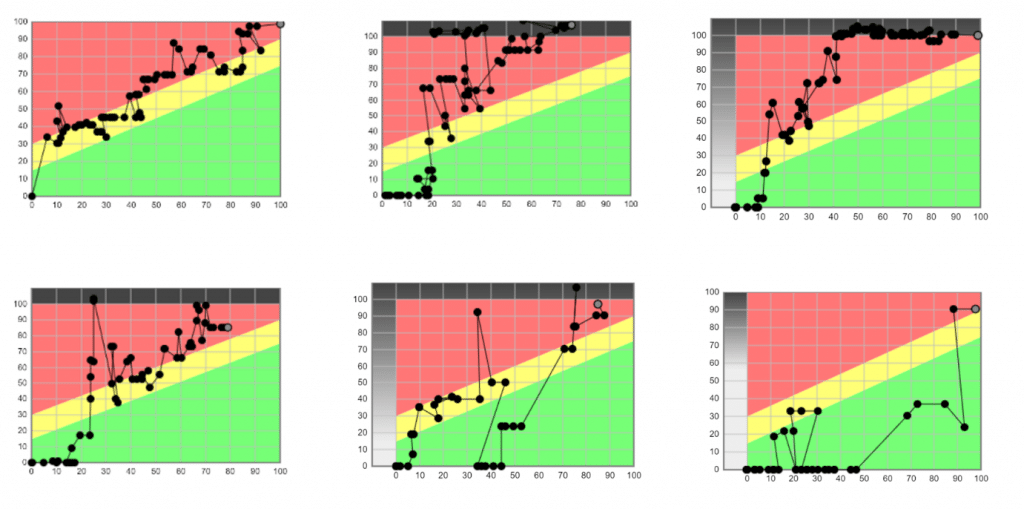
We see that for 3 of the 4 projects, the start-up is relatively fast. But between 15 and 25% of progress, the consumption of the buffer explodes.
In facts, this is what this company has achieved!
The teams took several actions to prevent this from happening again. It is not about describing these actions here because they are specific.
However, the correct use of the fever chart makes it possible to observe trends and levers for improvement within your projects and within the project portfolio.
In the next and final article in this series, we will see how the fever chart can help you identify the project teams' behaviors during the project.
In the meantime, if you have any questions or wish to discuss these topics, feel free to contact us!
About the author
Go further
 Coaching
Moving from a linear model to a circular one while remaining efficient - everything is a question of design, including for the Supply Chain.
 Flow Project Management
At this point, everything is going well: But, there are several projects that use the same resources. So, how do you manage this? Most people will tell you that having a project management tool that collects load and capacity will help you drive your choices. This is simply not true. Most load / capacity tools … Continued
 Flow Project Management
Once you have completed your project plan, sized the tasks and avoided creating a labyrinthine system with too much detail, you need to move on to the step that will identify the most time critical task sequence. At this point, we recommend that you use the critical chain approach. Unlike the critical path approach, which … Continued
Does this article resonate?
Our consultants help you translate these reflections to your Supply Chain and your teams — diagnosis, scoping or operational delivery.